Control limits are very important tools in winning the battle against process variation. First let’s look at the different limits available in Quality Window and their roles.
Targets (green) – the value you would ideally like to maintain for quality, performance and cost reasons.
Warning Limits (yellow) – these indicate values that are now closer to a Control Limit rather than the Target value – the first symptom of variation.
Control Limits (red) – usually based on Process capability and act as indicators of when a process is outside of its capable/normal performance range and should be reviewed to determine cause and action to take.
Specification Limits (white) – indicates a value is outside acceptable limits and immediate action should be taken.
Now, each limit within a Quality Window Application can be set as one of the following:
Blank – no limits
Calculated – typically using a multiple of the Standard Deviation of the Population but with options available (see below)
Fixed – set manually
This discussion will focus on the options available for calculated limits and espeically when used for Control Limits.
Part of any ongoing continious improvement process is to get better – minimize variation – and then adjust or re-fix your control limits accordingly. This can be a long and ardurous process if you are monitoring hundreds or thousands of variables in your process or product.
As I mentioned earlier there are three types of limits and I would recommend setting Control Limits to calculated. Now, this alone is not enough to ensure reasonable and realistic limits are derived.
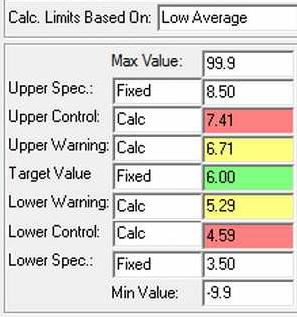
A setting just above the Limits window labelled “Calc. Limits Based On” gives you the additional capability to calculate the limits more accurately. The options here are:
Population
MR Estimate
Low Variation
High Variation
Low Average
High Average
I would suggest selecting Low Variation. What this will do is scan the data for the variable and select 20 consecutive points that have the lowest Standard Deviation and then use that value to calculate the control limits. (+- 3 times Lowest SD)
This means your control limits always reflect the best recent performance you were able to achieve which in turn means that you don’t have to keep manually adjusting your Control Limits every month or so.
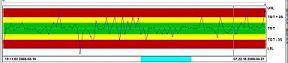
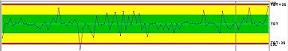
The following charts demonstrate Control Limits set with Low Variation and the second with using the Standard Deviation of the Population.
Low Variation
SD of Population
The Low Variation option provides you with Control limits away from the Specification limits thus giving you ample warning of process upsets as an Out of Control situation rather than Out of Specification or reject level.
Quality Window gives manufacturing teams the tools they need for real-time SPC monitoring, automated CoA generation and fast root-cause analysis. Start your free trial and see how it can improve your process quality.
To provide the best experiences, we use technologies like cookies to store and/or access device information. Consenting to these technologies will allow us to process data such as browsing behaviour or unique IDs on this site. Not consenting or withdrawing consent, may adversely affect certain features and functions.
Functional
Always active
The technical storage or access is strictly necessary for the legitimate purpose of enabling the use of a specific service explicitly requested by the subscriber or user, or for the sole purpose of carrying out the transmission of a communication over an electronic communications network.
Preferences
The technical storage or access is necessary for the legitimate purpose of storing preferences that are not requested by the subscriber or user.
Statistics
The technical storage or access that is used exclusively for statistical purposes.The technical storage or access that is used exclusively for anonymous statistical purposes. Without a subpoena, voluntary compliance on the part of your Internet Service Provider, or additional records from a third party, information stored or retrieved for this purpose alone cannot usually be used to identify you.
Marketing
The technical storage or access is required to create user profiles to send advertising, or to track the user on a website or across several websites for similar marketing purposes.