Sometimes the way data is collected does not match how you want to analyze it. Views in Quality Window allow you to reshape that data using Pivoting and Summarizing.
These features help you transform raw data into more meaningful insights without changing the underlying application.
When to Use Pivoting and Summary Views
Use pivoting and summarizing when:
- You want to break data out by category (for example Team, Product, Shift)
- You need totals, averages, or other statistics
- You want to analyze performance across groups instead of individual records
- You want to prepare data for reporting or charting
Example Scenario
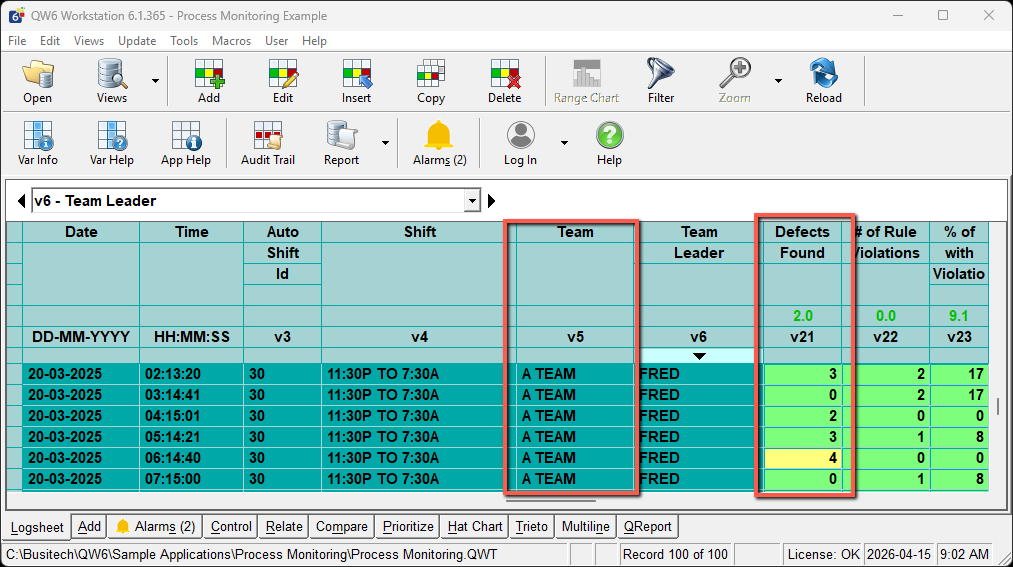
In our process monitoring application example (Installed at: C:\busitech\qw6\samples\Process Monitoring):
- Team is recorded in a text variable (for example V5 – Team)
- Defects Found is recorded in a numeric variable (for example V21 – Defects Found)
Each record contains total defects for a sample. Pivoting allows you to reorganize this data by Team.
Creating a Pivot View
Pivoting is configured in QW Workstation using Views Manager.
- Open the application in QW Workstation
- Open Views Manager
- Go to the Variables tab
By default, all variables are shown.
- Click Clear to remove all variables except Date and Time
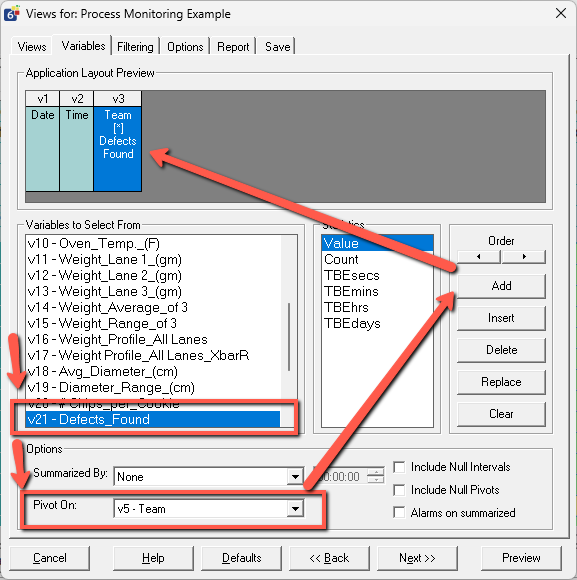
To configure the pivot:
- Select the numeric variable (for example Defects Found)
- In the Pivot On field, select the grouping variable (for example Team)
- Click Add to create the pivoted variable
- Click Run to execute the view
How Pivoting Works
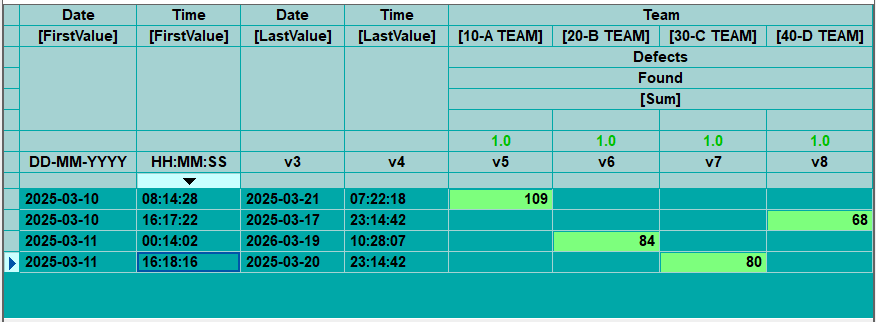
When a pivot is applied:
- Each unique value in the Pivot On field becomes a new column
- The numeric variable is distributed across those columns
- Each column represents a category (for example each Team)
For example:
- Team A → Column A
- Team B → Column B
- Team C → Column C
This allows you to compare values side by side.
If records contain blank values in the pivot field:
- A Null column may be created
- This can be controlled using the Include Null Pivots option

Summarizing Pivoted Data
Once data is pivoted, you can summarize it to produce higher-level insights.
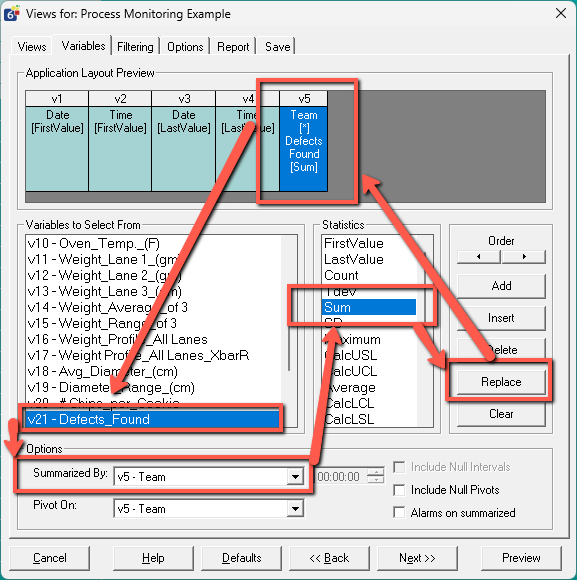
To summarize:
- Return to Views Manager
- Go to the Variables tab
- In the Summarized By field, select the grouping variable (for example Team)
- Choose the desired statistic (for example Sum instead of Average)
- Click Replace to update the variable
- Click Run to execute the view
- You can optionally add Date and Time variables with a Last Value Statistic to clearly show the start and end times of the summary
How Summarizing Works
Summarizing changes the data from individual records to grouped results.
- Data is grouped based on changes in the selected variable
- A statistic is applied to each group
Common statistics include:
- Sum
- Average
- Count
- Minimum / Maximum
This allows you to move from:
- Raw data → individual samples
to - Aggregated data → totals by Team, Shift, or Category
Pivot vs Summary
Pivoting and summarizing are often used together but serve different purposes:
- Pivoting → restructures data into categories (columns)
- Summarizing → aggregates data into totals or statistics
Together, they allow you to:
- Break data apart
- Then roll it back up in a meaningful way
Practical Use Cases
- Defects by Team or Shift
- Downtime by Area, Reason, or Cause
- Production totals by product or line
- Quality metrics grouped by operator or machine
Key Considerations
- Pivoting creates new columns dynamically based on data values
- Summarizing groups data and applies statistics
- Pivot and summary views do not change the underlying data
- These views are ideal for reporting and analysis