Quality Window’s Report Documents feature makes it easy to generate professional Certificates of Analysis (COAs) directly from your data. Along with live values, you can automatically include statistical summaries such as averages and other calculations from QW StatSense, making it ideal for batch-based testing and lab environments.
Once set up, COAs can be produced in seconds using live data and calculated statistics from your application without manual formatting or external tools.
Why use Report Documents for COAs
Report Documents go beyond simple reporting by combining live data, calculated statistics, and user input into a single, repeatable workflow.
You can:
- Pull live values directly from your data
- Leverage built-in statistical calculations in your reports
- Prompt users for additional values at runtime
- Standardize formatting across all outputs
- Eliminate manual transcription errors
This makes them ideal for COAs where accuracy, traceability, and consistency are critical.
How it works
Creating a COA in Quality Window involves an initial configuration followed by a simple user workflow.
Configuration (done once in QW Admin):
- Open the application in QW Admin (Maintain Application)
- Create a new Report Document
- Configure document properties, including:
- Data source (application or referenced view)
- Output location for generated documents
- Design the document layout, including images, tables, and text
- Insert tokens for data, statistics, and prompts
- Test the report to confirm output and formatting
Usage (done by end users):
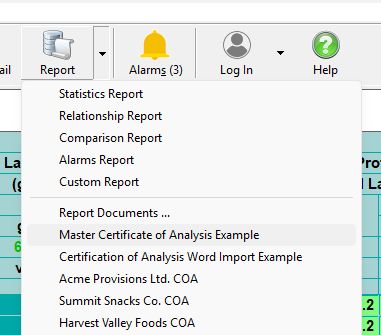
- Generate the COA directly from the application
Once configured, the Report Document is available to users and can be generated on demand without additional setup.
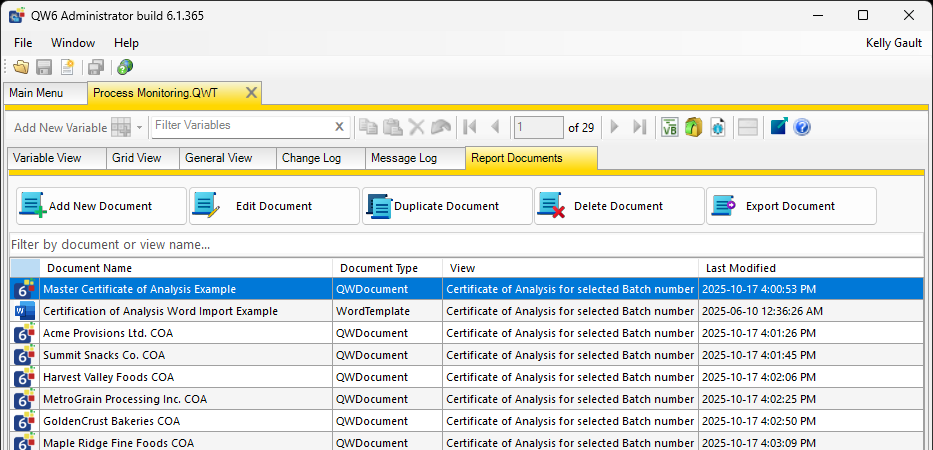
Step 1: Open Report Documents in QW Admin
To begin:
- Open QW Admin
- Go to Maintain Application
- Open the application where you want to create the COA
- Select the Report Documents tab
This is where all report templates are created and managed.
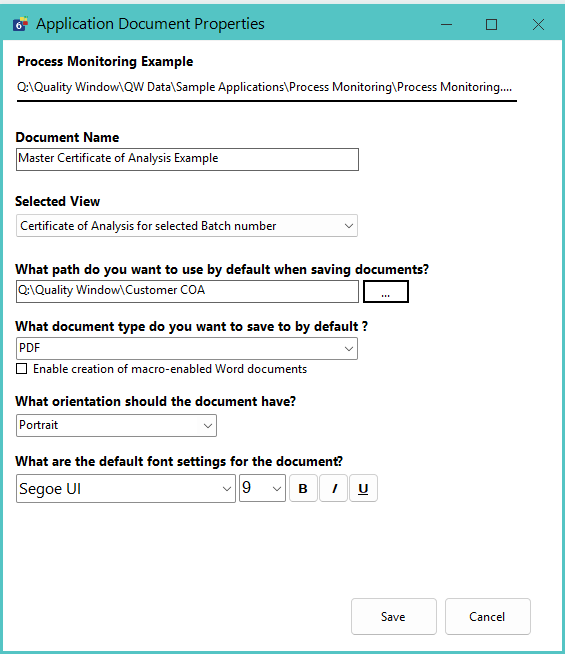
Step 2: Create and configure the Report Document
Add a new Report Document and configure how it will behave.
This includes:
- Defining the data source:
- Use the base application
- Or reference a view for more control over the dataset
- Setting the output location for generated documents
For most COA use cases, referencing a view is recommended so you can control exactly what data is included.
Step 3: Design your COA layout
Design the structure and appearance of your COA using the editor.
This can include:
- Images such as logos or branding
- Tables for organizing results and statistics
- Text for product descriptions, compliance statements, and formatting
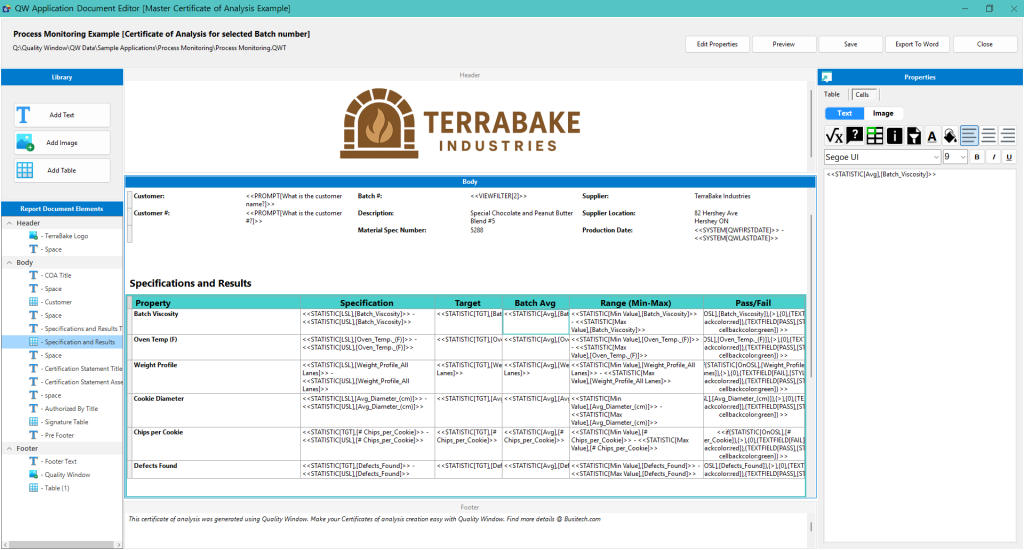
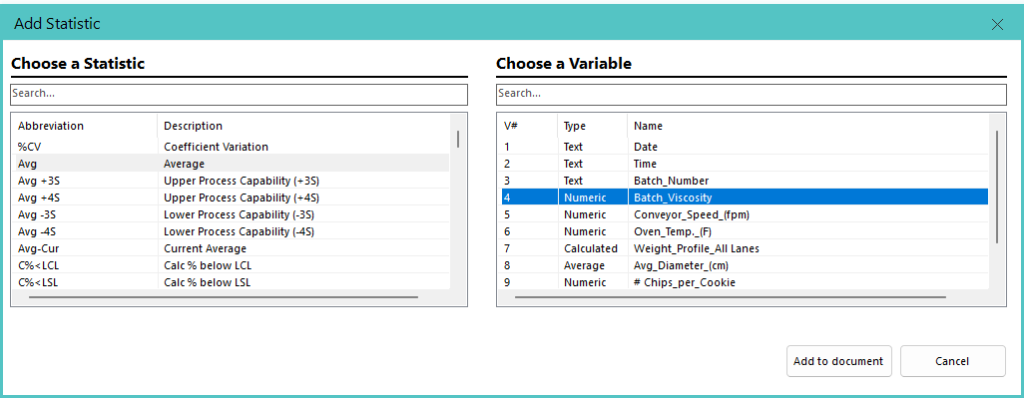
Step 4: Insert dynamic data, statistics, and prompts
Use tokens to populate your COA with live and calculated values.
This can include:
- Variable results such as test values and measurements
- Statistical calculations from StatSense
- Dates, times, and user information
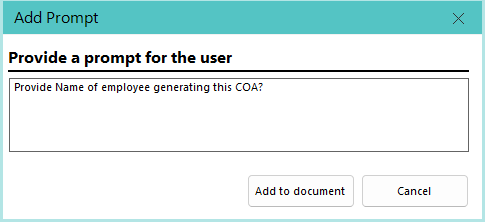
You can also configure prompts to capture values at the time of report generation, such as:
- Sign-off or approval names
- Customer references
- Additional context not stored in the dataset
Step 5: Generate the COA
Once configured, users can generate the COA directly from the application.
- Run the Report Document from the application
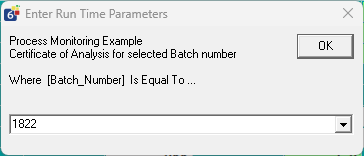
If a view is referenced in the configuration, Quality Window will:
- Load the view in the background
- Apply any configured filters automatically
- Prompt for filter values if required
The system will then:
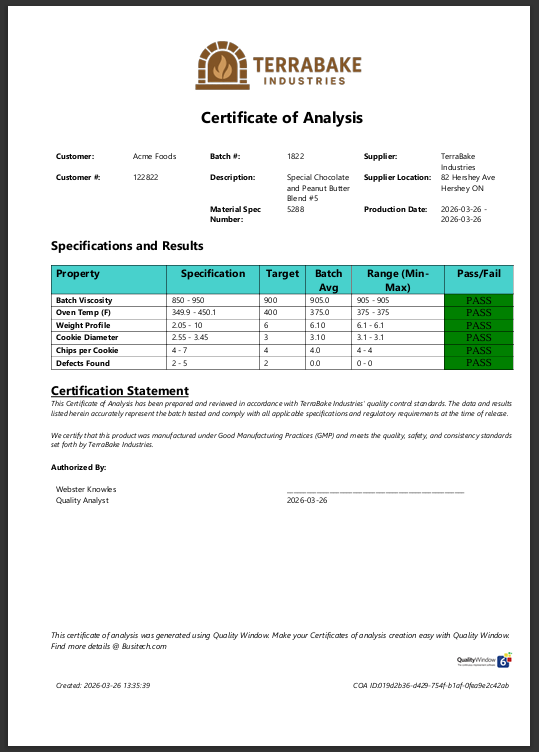
- Populate all tokens with live data and calculated statistics
- Prompt for any additional input values
- Output a formatted COA ready for distribution
Final result
The generated COA reflects your template design and is populated with live data, calculated statistics, and any required user inputs based on the configured application or view.
Where this is commonly used
Report Documents are commonly used for:
- Batch release COAs
- Lab test summaries with statistical outputs
- Customer-facing compliance reports
- Internal quality documentation
Key advantage
Your COA becomes part of your data workflow rather than a separate process. By combining live data, QW StatSense calculations, configured views, and user prompts, you can generate complete, accurate reports with far less manual effort.