This guide walks you through creating your first chart in Quality Window using a sample Excel file.
No setup required. Just open Excel and preview.
What You Need
- Quality Window installed
- Access to the sample Excel files:
- C:\Busitech\QW6\Sample Applications\Sample Excel Files
Use: Quality Sampling Example.xlsx
Step 1 – Open Excel First
Open Quality Sampling Example.xlsx in Excel
Close any other Excel windows, or make sure this file is the active Excel window
Quality Window reads from the active Excel instance.
Important: Open the Excel file before starting Quality Window. If Excel is not open, no data will load.
Step 2 – Open Quality Window and Import
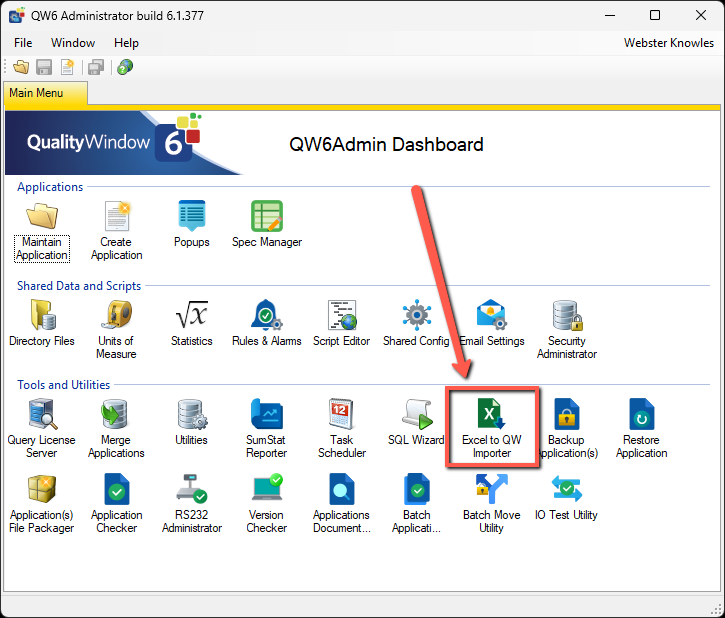
Open Quality Window Admin
Click Excel to QW Importer
The importer will automatically load data from the active Excel file.
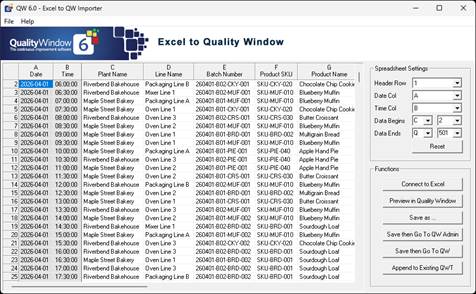
Step 3 – Confirm Data is Loaded
You should see your Excel data in the importer grid
If no data appears:
Click Connect to Excel
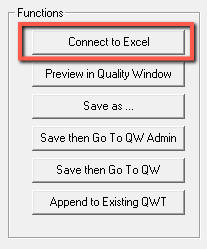
Make sure your Excel file is the active window
Try again
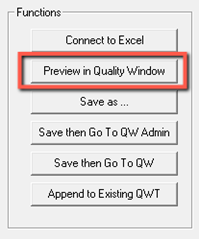
Step 4 – Preview in Quality Window
Click Preview in Quality Window
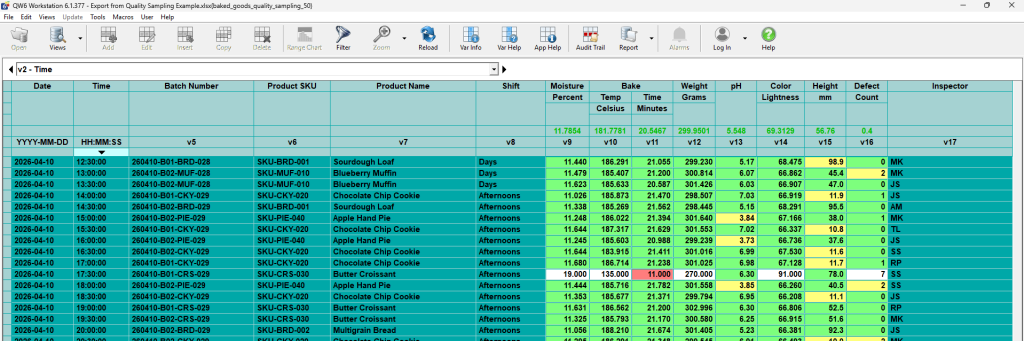
This will open Quality Window Workstation and display your data in the logsheet.
What You’re Looking At
Your data is now active inside Quality Window.
This is not a static spreadsheet.
Values are automatically evaluated and highlighted:
- Green = Target Range
- Yellow = Warning range
- Red = control limit violation
- White = outside specification
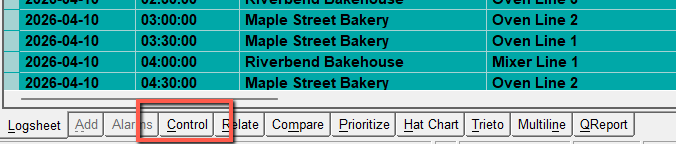
Step 5 – View Your First Chart
At the bottom of the screen, click Control
A control chart will appear automatically using your data.
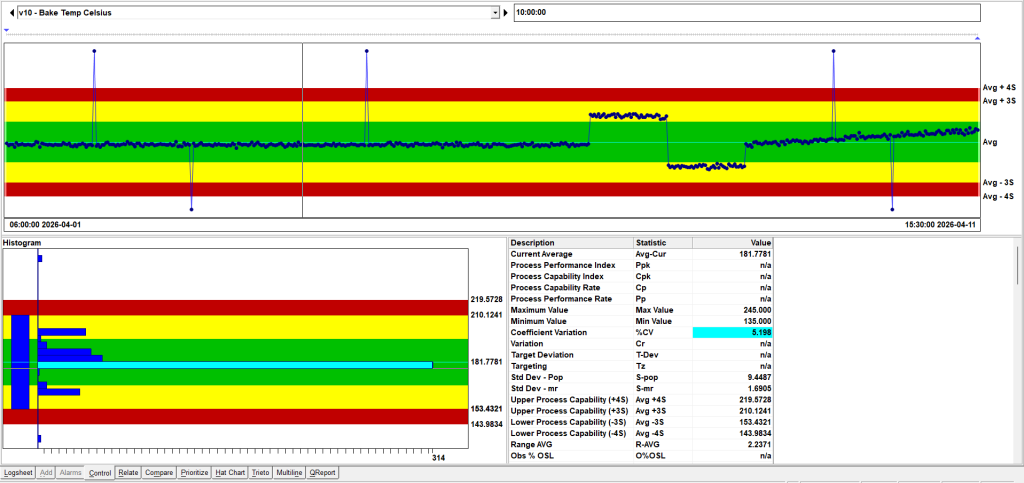
What to Look For
The chart shows how your process behaves over time
Points outside limits are automatically highlighted
In the bottom right:
QW StatSense displays calculated statistics
In the bottom Left:
The Histogram shows the distribution of the data
You’re Done
You’ve taken raw data and turned it into a live chart with automatic evaluation.
Your data is now:
- Evaluated automatically
- Visualized with control charts
- Summarized with key statistics
What to Do Next
Use Your Own Data
You’ve seen how it works with sample data. Now try your own Excel file using the same process.
If your file is structured differently, start with a small sample and adjust from there.
If you want a walkthrough,
Explore More Examples
See how Quality Window is used across different scenarios.
Browse the sample applications included with your installation to understand what’s possible.
- Sample Applications in QW6
- Sample Application – Combining Capabilities to Achieve Results
- Sample Applications – Interfacing to databases in QW6
- Get Started Guide
- Knowledge Base
Need Help Getting Your Data Working?
If your data is more complex, we can help you get your first application set up quickly.
We’ll respond quickly and can set up a short call to help you get your data working.
Evaluating for Production Use?
If you’re considering Quality Window for real-world deployment, we can walk through your environment, licensing, and rollout options.
Notes
- Quality Window reads from the active Excel instance
- If the wrong file loads, activate the correct Excel window and click Connect to Excel
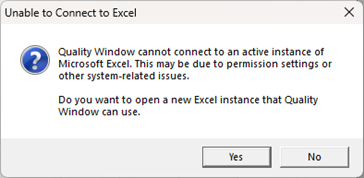
- If Excel cannot be detected, a prompt will appear
- Click Yes to open a new Excel instance
- Re-open your file in that window
- Some analysis views require specification limits and additional setup