
SumStat is the analysis, reporting, and automated delivery tool for Quality Window. It helps manufacturing quality and process teams bring data from multiple Quality Window applications into a common analysis, investigate statistical and record-level results, generate reports, and automate recurring reporting workflows.
| At a glance Use SumStat when you need to compare data across Quality Window applications, repeat the same analysis consistently, investigate the observations behind the statistics, or deliver recurring reports without manually rebuilding the analysis each time. |
Rather than opening applications individually and compiling results manually, SumStat uses a reusable configuration that defines the Quality Window sources, variables, statistics, filtering, and reporting behavior for an analysis.

What SumStat Does
SumStat extends Quality Window beyond individual applications by providing a reporting and analysis layer across one or more Quality Window sources. Quality Window remains where the manufacturing data is collected and managed; SumStat uses those configured applications and Views to perform broader analysis, investigation, reporting, automation, and delivery.
- Consolidate results from multiple Quality Window applications into one analysis.
- Calculate and compare selected variable statistics and application-level summary statistics.
- Normalize results using record counts or configured production volume.
- Investigate the individual observations behind statistical results when record-level detail is required.
- Identify records outside fixed specification limits.
- Generate standard HTML, PDF, Excel, CSV, Dashboard, HatChart, detailed, and exception reports.
- Save the analysis as a reusable .SUM configuration.
- Run saved configurations interactively or through unattended and scheduled execution.
- Automatically deliver supported reports using the Quality Window email infrastructure.

When to Use SumStat
SumStat is especially useful when the same question needs to be answered across multiple Quality Window applications or when a recurring analysis needs to be repeated consistently.
- Compare process performance across production lines, products, or applications.
- Review the same statistics across several Quality Window applications.
- Identify variables that may require attention and investigate the records behind the result.
- Review specification exceptions without scanning every record manually.
- Produce recurring quality or process reports from a saved configuration.
- Distribute supported reports automatically to people who do not need to work directly in SumStat.
Getting Started with SumStat
SumStat is launched from Quality Window Admin using the SumStat Reporter option. The steps below provide a basic workflow. For complete configuration details, report descriptions, automation setup, and administrative guidance, see the SumStat Reporter Administrator Guide.
1. Configure the report
On the General tab, define the report title, report location, report output location, variable matching method, volume behavior, filtering options, and any script procedure that should execute after the query. The script procedure is required when the saved configuration is intended to run an automated report.
2. Select Quality Window applications
Add the Quality Window applications that should participate in the analysis. Each application can use a Quality Window View to establish the base dataset for that source.
3. Apply SumStat filtering
When a Quality Window View is selected, the View defines the base dataset and SumStat filtering is applied to that dataset. This allows the View to establish the records relevant to the analysis while SumStat applies additional reporting criteria.
4. Select variables
Choose the variables that should be included in the analysis. SumStat maps the selected variables to the corresponding variables in each participating Quality Window application using the configured variable matching method.
5. Select statistics and summary statistics
Choose the statistics SumStat should calculate for each selected variable, along with any application-level summary statistics required for the analysis or report.
6. Run the query
Run the SumStat query to process the selected applications and calculate the configured results. The standard on-screen results view lets you review a selected statistic across participating applications and switch between Non-Normalized and Normalized by Volume results.
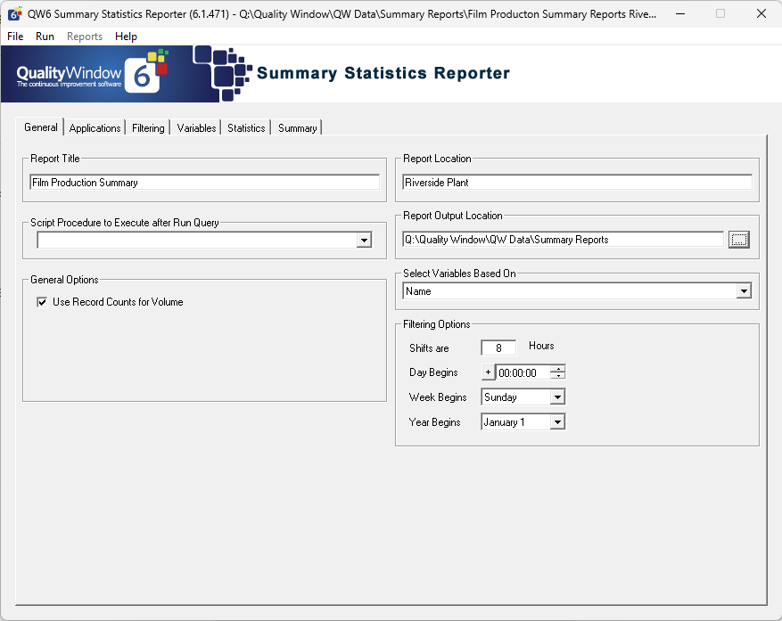
SumStat configuration screen
Variable statistics
For definitions, calculation details, and guidance on the statistics available in SumStat, see the Quality Window Statistics Reference.
Choosing a Report
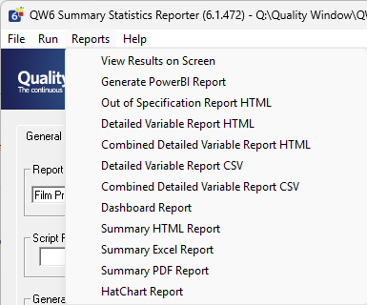
After the query has been configured and tested, select the report that best matches how the results need to be reviewed, investigated, shared, or exported.
| Report | Use |
| View Results on Screen | Interactively review calculated SumStat results. |
| Dashboard Report | Review statistical status and highlighting across applications. |
| Summary HTML Report | Generate a browser-based statistical and summary report. |
| Summary PDF Report | Generate a fixed document suitable for sharing or archiving. |
| Summary Excel Report | Generate statistical results for further spreadsheet analysis. |
| HatChart Report | Compare process targeting (Tz) and variation (Cr) across selected variables. |
| Detailed Variable Report HTML | Review statistics together with the individual records behind the results. |
| Combined Detailed Variable Report HTML | Combine detailed record-level information from participating applications into a single report. |
| Detailed Variable Report CSV | Export detailed record-level information to CSV. |
| Combined Detailed Variable Report CSV | Generate the same combined detailed information as the HTML report in CSV format without report branding. |
| Out of Specification Report HTML | Identify and investigate records outside fixed specification limits. |
Save and Reuse the Configuration
Once the analysis has been configured and tested, save it as a .SUM file. The saved configuration can be reopened later for additional analysis or used as the basis for unattended reporting.
This allows teams to configure an analysis once and repeat it without rebuilding the application, variable, statistic, and filtering selections each time.
Automating SumStat Reports
Saved .SUM configurations can also be used for unattended execution. This allows a tested SumStat configuration to run automatically and generate the configured report without requiring a user to work through the SumStat interface.
A .SUM configuration can be scheduled using the Quality Window Task Scheduler. Supported reports can also be configured for automatic email delivery using the centralized Quality Window email infrastructure.

Email delivery and related report automation are configured through the SumStat reporting script. For complete setup and maintenance guidance, see the SumStat Reporter Administrator Guide or contact Busitech Support.
Custom Reporting
SumStat can be adapted by Busitech to support reporting requirements that are not addressed by the standard reports. This can include reports designed around specific customer, process, operational, or data-delivery requirements.
If you have a unique reporting requirement or would like to discuss adapting SumStat for a specific use case, contact Busitech Support at support@busitech.com.
Performance Considerations
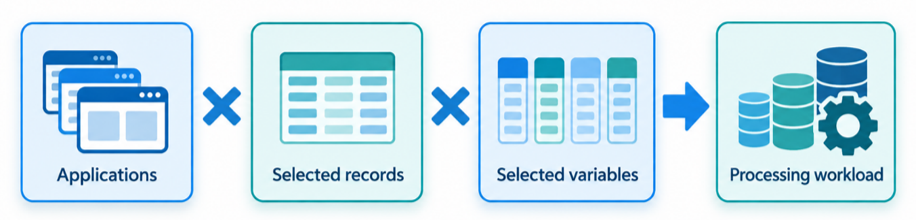
Some SumStat reports require more processing than others. Statistical reports primarily use the results calculated by SumStat. Detailed reports must also process and retain individual record-level values.
For detailed reporting, the amount of work is influenced by the number of applications, selected records, and selected variables. Large queries containing many applications, records, and variables may therefore require more processing time and memory.
Learn More
For complete setup instructions, report descriptions, automation configuration, and administration guidance, see the SumStat Reporter Administrator Guide.
For assistance with SumStat configuration, report customization, automation, or delivery requirements, contact support@busitech.com.