
Overview
Filters control which records are loaded into Quality Window for viewing, charting, and analysis.
When records are loaded, Quality Window does more than display them. It also performs the processing required for the current dataset, including statistical calculations, status and colour evaluation, and the resolution of popup and lookup values.
Because of this, filters are important for both finding the records you need and maintaining a responsive experience.
This article explains how Quality Window loads data, how the Filter window works, and how to create filters for common tasks.
Understanding How Data Is Loaded
Quality Window can load records in several ways.
Opening a QW Application
When a QW application is opened without a default View, Quality Window uses the Number of Historical Data Points setting to determine how many records to load.
This setting is configured for the application in QW Admin – General View tab.
The records are loaded starting with the most recent record and working backwards. For example, if the setting is 100, Quality Window loads the 100 most recent records.
The default value is 100. The value must be greater than zero, or set to -1 to load all records.
Setting the value to -1 is supported, but is not recommended for applications with a large number of records or variables because it can significantly increase loading and processing time.
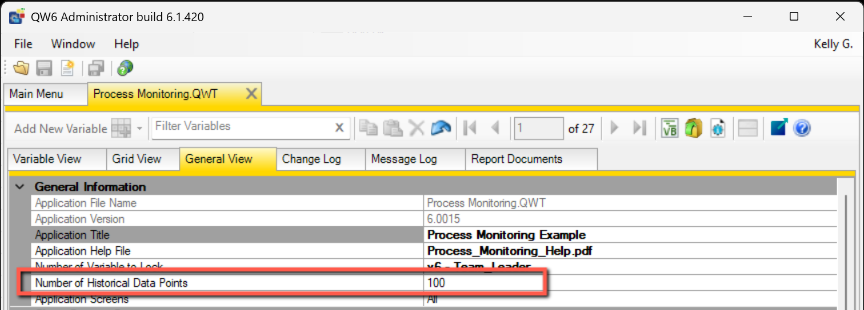
When a default View is configured, the Number of Historical Data Points setting is ignored. The filter saved with the default View determines which records are loaded.
Opening a View
A View can contain its own saved filter.
The View may control:
- Which records are loaded
- Which variables are displayed
- The order and layout of the information
When the View is opened, Quality Window runs the saved filter and loads the matching dataset.
If a View is configured as the default View for the application, it determines what is loaded when the application opens.
Applying a Filter
You can open the Filter window at any time to load a different set of records.
Selecting Preview runs the filter and loads the matching records. The filter is not saved unless it is later saved as part of a View.
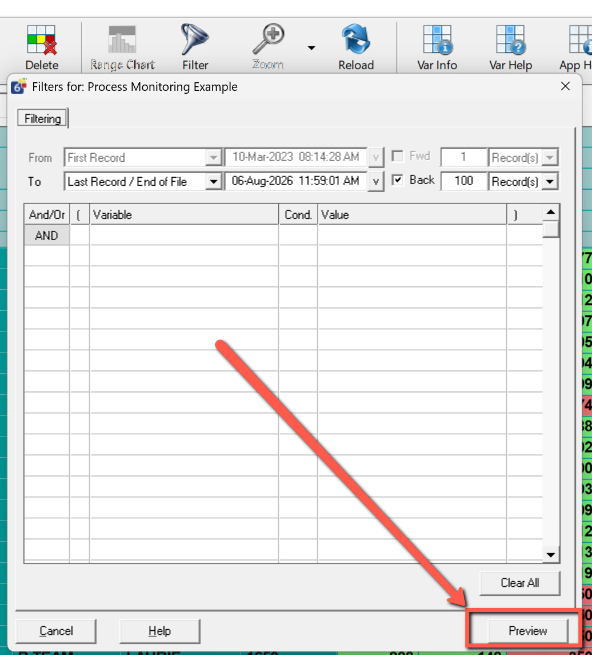
Opening the Filter Window
Open the Filter window from the Quality Window toolbar or menu.
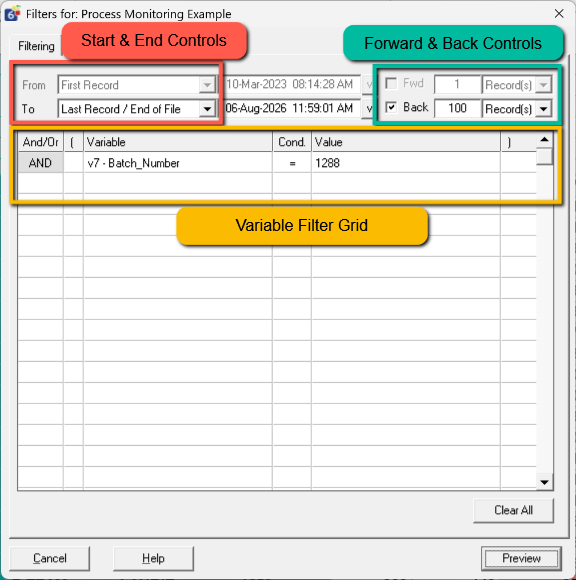
The Filter window contains three main areas:
- Start and end controls
- Forward and Back count controls
- Variable filter conditions
These options can be used independently or together.
Selecting the Start and End of the Dataset
The start and end controls define the boundaries of the records to load.
The start of the dataset can be based on options such as:
- Beginning of the current or previous year
- Beginning of the current or previous quarter
- Beginning of the current or previous month
- Beginning of the current or previous week
- Beginning of the current or previous day
- Beginning of the current or previous shift
- Beginning of the current or previous hour
- First record
- A specific date and time
The end of the dataset can be based on options such as:
- End of the current or previous year
- End of the current or previous quarter
- End of the current or previous month
- End of the current or previous week
- End of the current or previous day
- End of the current or previous shift
- End of the current or previous hour
- Last record
- A specific date and time
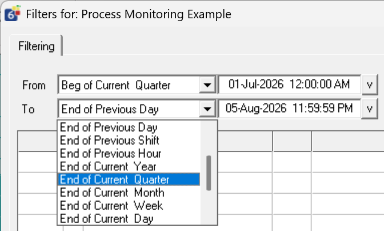
Example: Load the Current Month
To load records from the current month:
- Set the start of the dataset to Beginning of Current Month.
- Set the end of the dataset to End of Current Month.
- Select Preview.
Quality Window loads the records that fall within the current month.
Using Forward and Back Counts
Count-based filters allow you to load a defined amount of data from a selected starting or ending point.
Counts can be based on:
- Years
- Quarters
- Months
- Weeks
- Days
- Shifts
- Hours
- Minutes
- Seconds
- Records
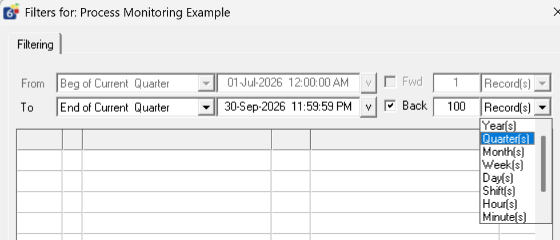
Forward Count (FWD)
A forward count starts from the selected beginning point and moves forward.
For example, you could load:
- Seven days starting from a specific date
- 100 records starting from the first matching record
- Eight hours starting from the beginning of a shift
Back Count
A back count starts from the selected ending point and works backwards.
This is useful for loading the most recent data.
For example, you could load:
- The last 100 records
- The previous 24 hours
- The previous seven days
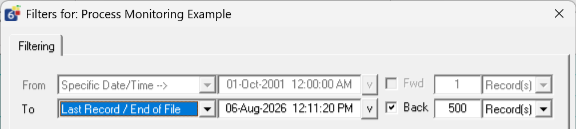
Example: Load the Last 500 Records
To load the 500 most recent records:
- Set the end of the dataset to Last Record / End of File.
- Enable the Back count.
- Enter 500.
- Select Records as the count type.
- Select Preview.
Filtering by Variable Values
The lower section of the Filter window allows records to be filtered based on variable values.
Each condition includes:
- Variable
- Comparison condition
- Value
Multiple conditions can be combined using AND and OR logic.
Parentheses can also be used to control how more complex filter statements are evaluated.

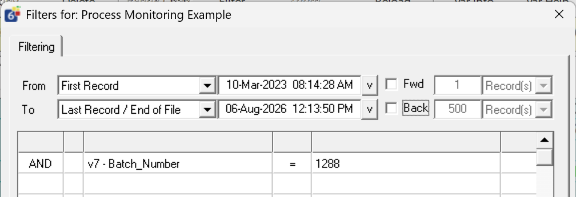
Example: Filter by Batch Number
To load records for one batch:
- Select the batch variable.
- Select the required comparison condition.
- Enter the batch number.
- Select Preview.
Only records matching that batch number are loaded.
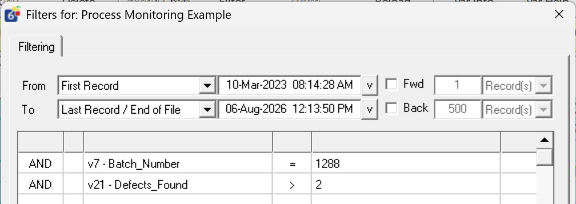
Example: Filter by More Than One Condition
A filter could be configured to load records where:
- The batch number matches a selected value
- AND the production line matches a selected line
This allows the dataset to be narrowed to the specific records required for the current task.
Using Runtime Prompts
A filter value can be set to ? to prompt the user when the View is opened.
This allows one View to be reused with different values.
For example, a View could prompt the user to enter:
- A batch number
- A lot number
- A product code
- An operator
- Another application-specific value
Runtime prompts are useful when the filter structure remains the same but the value changes each time.
See: How do I prompt a user for a value when running a View filter?
Common Filter Examples
Routine Data Entry
For routine data entry, load a limited number of recent records.
When no default View is configured, the Number of Historical Data Points setting in QW Admin determines the initial number of records loaded.
A setting between 100 and 500 records is recommended for most routine data-entry use cases.
Review the Current Shift
Quality Window can filter records using the beginning and end of the current or previous shift.
Shift-based filters depend on the shift schedule configured in View Manager. The configured shift times determine how Quality Window interprets options such as Beginning of Current Shift and End of Current Shift.
Review Yesterday’s Data
Use the beginning of the previous day and the end of the previous day.
Review a Specific Date Range
Use Specific Date/Time for both the beginning and end of the dataset.
Review One Batch or Lot
Use a variable filter to match the required batch or lot value.
A runtime prompt can be used when the batch or lot changes each time the View is opened.
Review a Larger Historical Dataset
Create a View with a filter designed for historical review.
This allows the normal data-entry View to remain focused on recent records while still giving users access to a broader dataset when required.
Filter Performance Considerations
The amount of work required to load a filtered dataset depends on more than the number of records.
Important factors include:
- Number of records loaded
- Number of variables included
- Statistical calculations required
- Popup and lookup values that must be resolved
- Status, alarm, and colour evaluation
- Workstation resources
- Network and file-access performance
A dataset can be large because it contains many records, many variables, or both.
For example:
- 100 records with 100 variables will generally load quickly.
- 20,000 records with 100 variables requires substantially more processing.
- 100 records with 700 variables may also require significant processing.
- A dataset with both a high record count and a high variable count can take much longer to load.
Quality Window performs this evaluation when records are loaded. This on-the-fly processing is what allows users to immediately review statistics, conditions, and visual status across the current dataset.
Best Practices
For routine data entry, use a smaller recent dataset.
Use Views to provide different loading strategies for different tasks, such as:
- Data entry
- Shift review
- Batch review
- Historical analysis
Use runtime prompts when the same View should be reused with different values.
Avoid loading all records unless the full history is required for the current task.
When a filter becomes slow, review both:
- How many records it loads
- How many variables and calculations are included
The best filter is one that loads enough data for the task while avoiding unnecessary processing.